Whenever I am in a factory or an office I look around to see what visual controls are in place. Surprisingly, particularly in offices, all too often there are none.
Most factories today display key performance metric data in work zones and review it on a daily basis. These review meetings are part of the heartbeat of the working day and drive actions for improvement and recovery.
Much of the data displayed is numbers and text. But often it is colour coded with charts and symbols to help make the information more readily understandable.
In contrast most offices are all too frequently a visual management desert. Even in project and sales offices there is a marked reluctance to put metrics up on the walls, on display screens and out in the open.
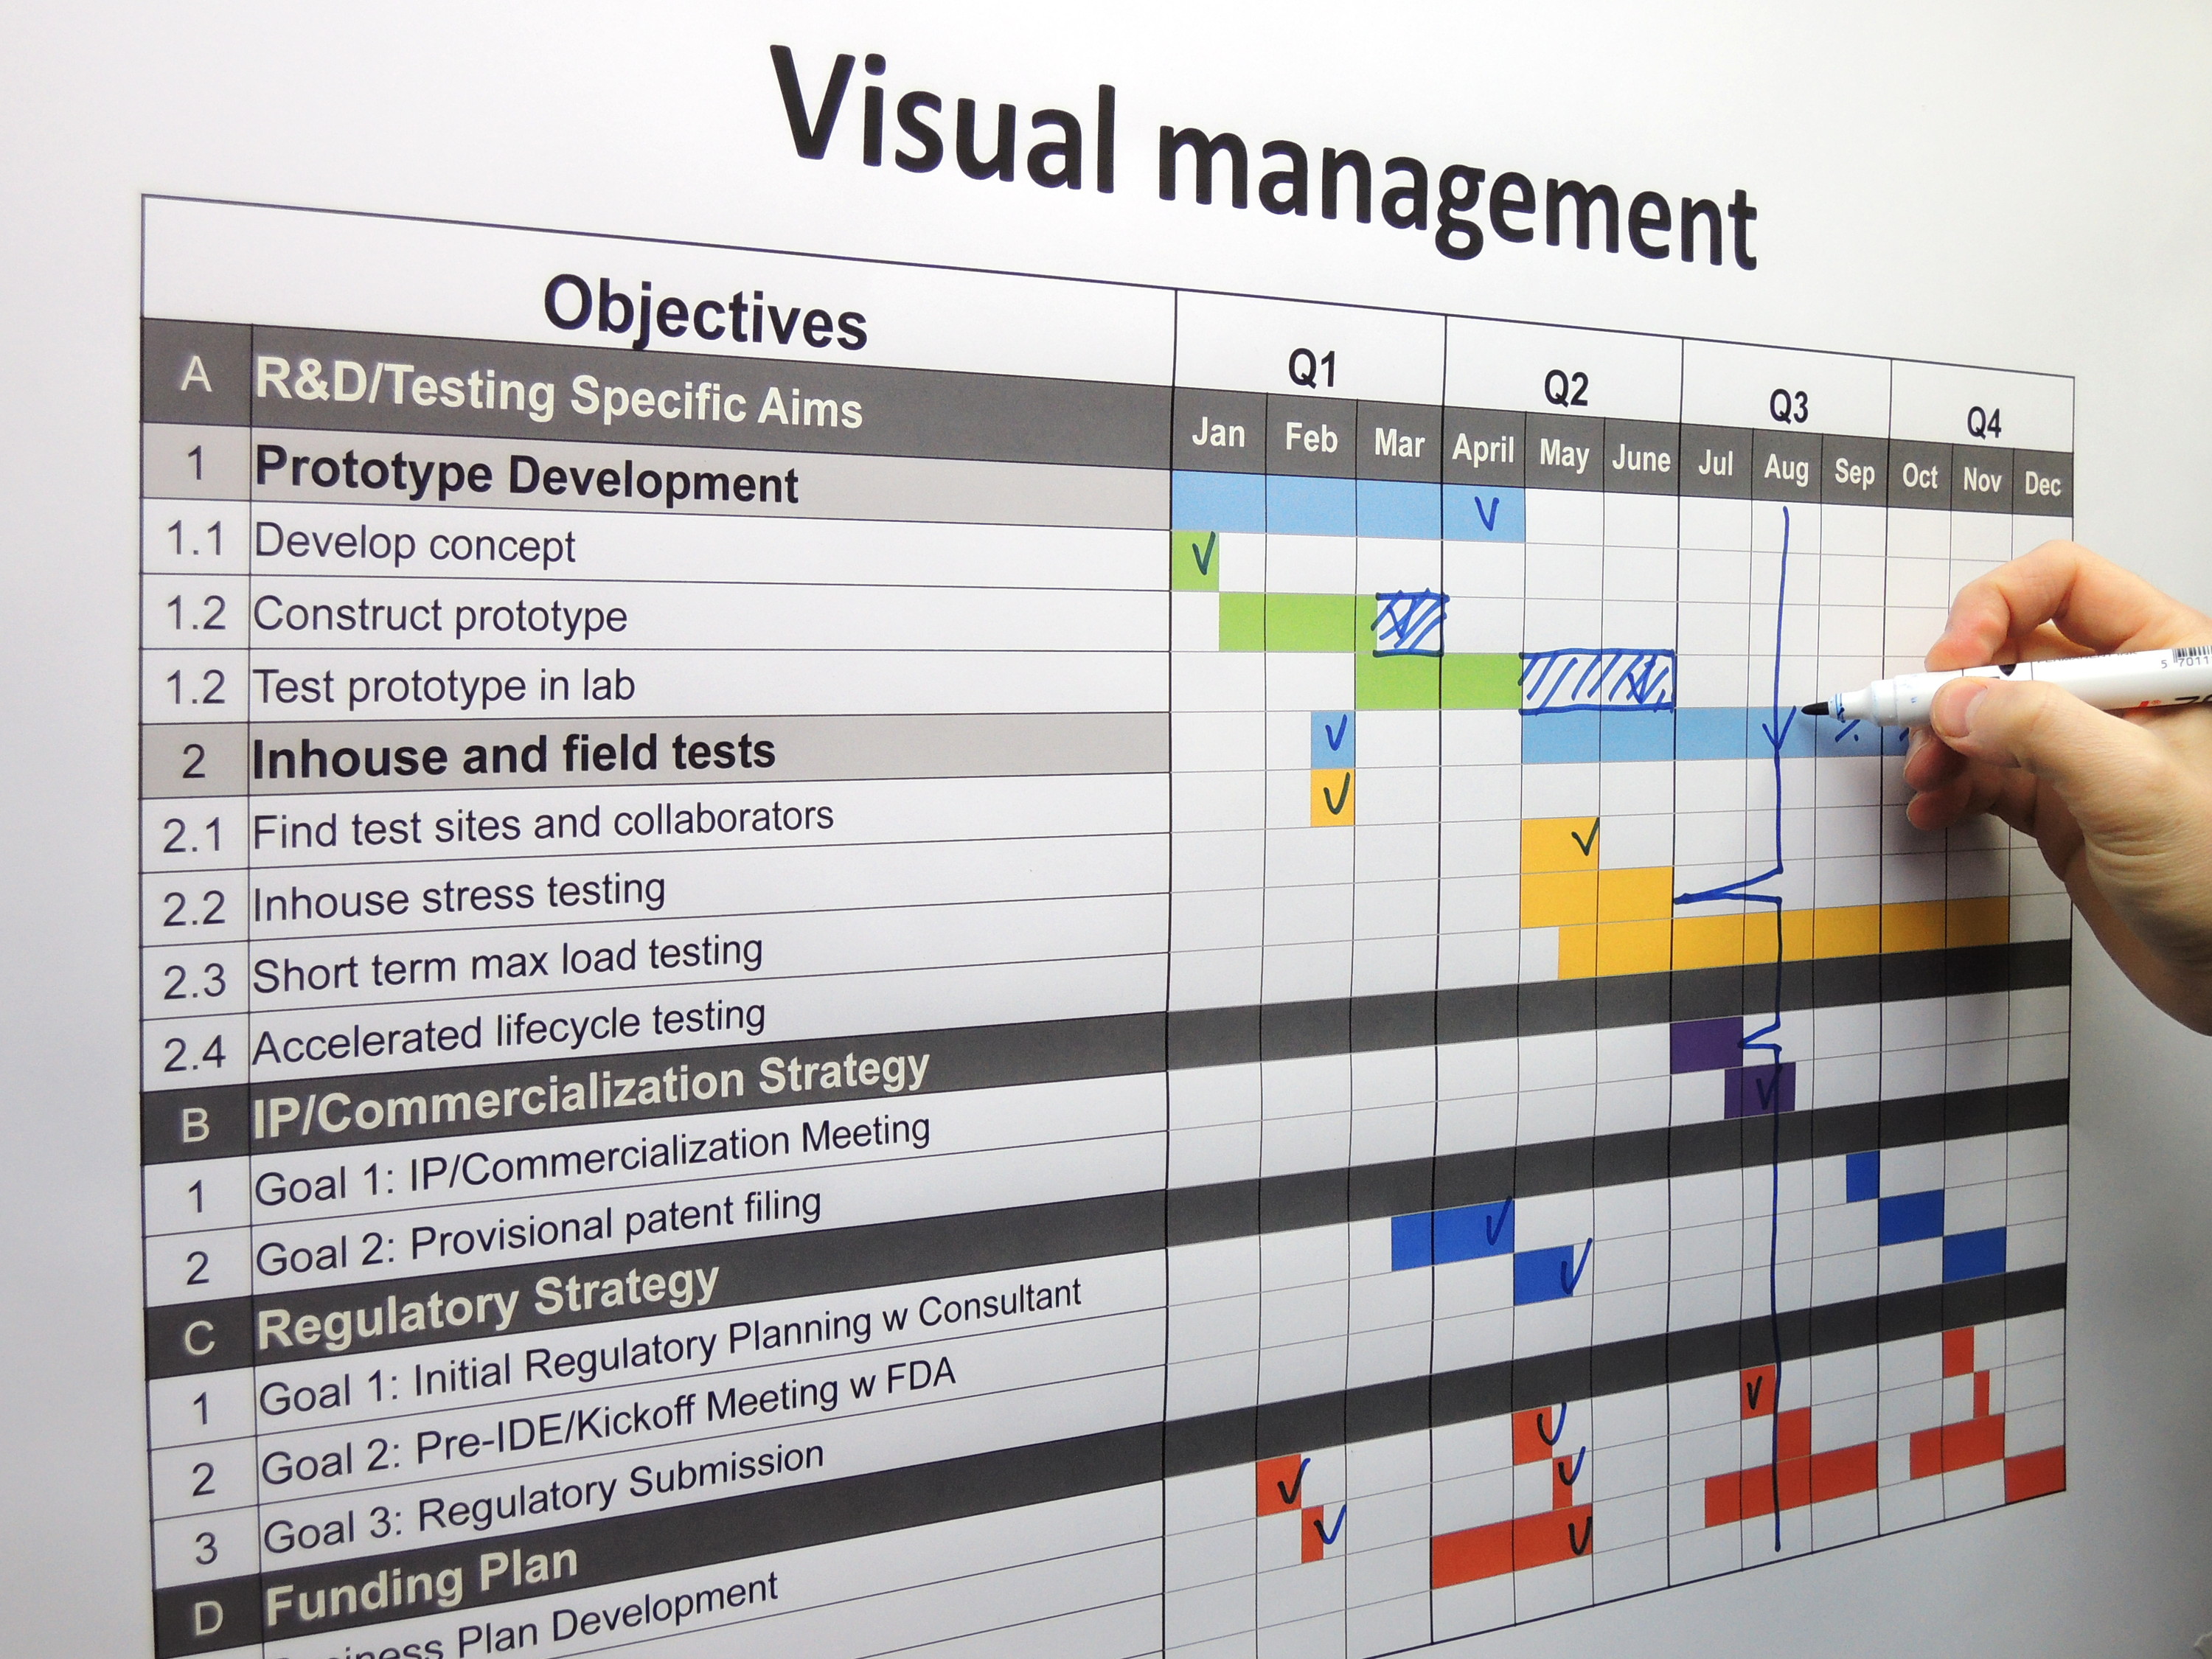
Visual management is a technique to communicate key information using a combination of visual signals, texts, and charts. At the simple end of the spectrum are hand annotated white boards, at the other are computer driven display screens. Whatever the display mechanism I have found introducing visual controls into office environments can help break down barriers between teams and functional departments.
A white board is a good place to start. It is low cost, simple to update and as you work with the information, it is easy to change the layout and presentation.
Good clear simple presentation helps so it is worth brainstorming with the team what data you want to share and why you want to share it. The point is not just to share information but also to control and guide action by the team members.
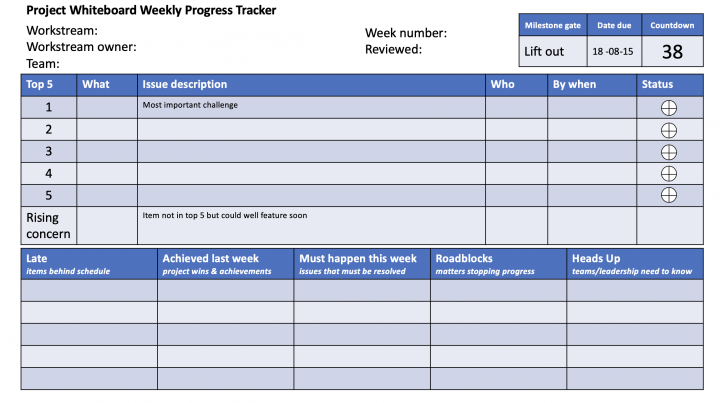
In a Projects business we designed a display format that enabled the project team to quickly review and communicate to Senior Management the key aspects of project performance. In addition to the traditional data and commentary on costs (budget, forecast, still to commit), the team had five topics to report:
- Late – items behind schedule
- Key achievements this month – project “wins” and actions completed
- Must happen next month – issues/items that must be resolved or milestones reached
- Roadblocks – matters stopping progress
- Heads up – issues that the team and Management should be aware of

Creating the display format led to a much more structured monthly project review meeting and formed the basis of regular weekly reviews by the Project Managers with their teams. Individual teams displayed their reports on wall mounted LCDs. Very soon they were adding other reports and pictures to the displays to share more with their colleagues.
In the service department, an LCD was installed to display the real time order capture, target and forecast sales information. Everyone knew what was going on. The focus was on closing and fulfilling orders.
Visual control systems are not just about shadow boards and metric displays in a factory, they can be used to facilitate the focus on key issues in office environments and help teams plan ahead to deliver a better outcome.
The key is to make sure what is being displayed is focused, relevant to driving the task and regularly reviewed by Management with the team.

